Your website's digital footprint. Tools to track its CO2 emissions

Co-founder and Head of Design of the Dodonut agency. Lean UX enthusiast, a Certificated Design Thinking moderator, and a workshop facilitator.
Date added
Read time
14 minSince you are on this blog, you are probably interested in measuring your carbon footprint. Digital footprint, also called a digital shadow, refers to the trail of data you leave behind during your online actions (e.g websites you visit) and the usage of your digital products by others.
While the tools and applications that check how fast and optimized a website is are nothing new under the sun, measuring a digital carbon footprint is still abstract for most people. But there are tools to track your digital footprint generated by your website. These algorithms are developed by NGOs and scientists who work to make them as perfect as possible. This article presents applications to help you start your journey toward sustainable design by measuring your environmental impact.
Table of contents:
There aren't that many applications of this type on the market, so we decided to write one article featuring websites that can quickly help you assess your carbon footprint, great tools that also offer analytics, and browser plug-ins that you can use to measure your personal carbon footprint.
If you happen to come across a new tool, drop us a line at [email protected]
Here is a list of chosen and analyzed mostly free tools for measuring digital footprint:
Website Carbon Calculator
https://www.websitecarbon.com/
Use case: quick evaluation
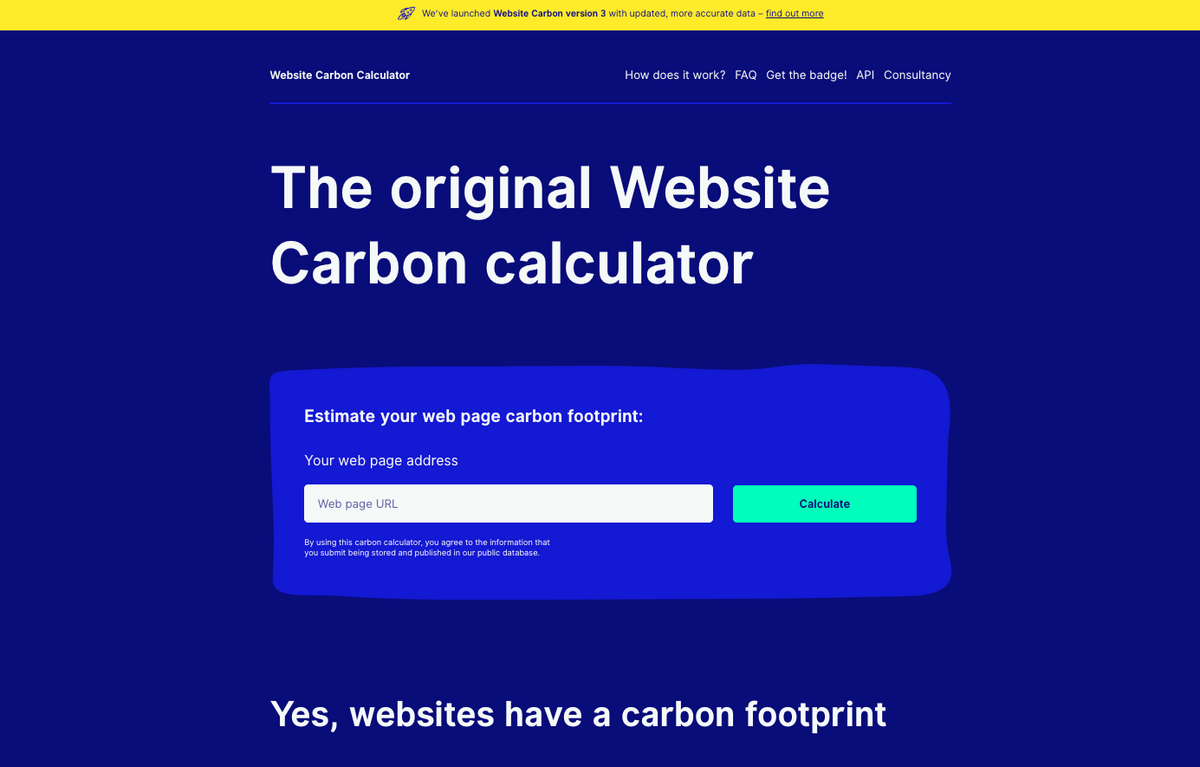
The page where you paste the URL, and after a second, you get results on how much CO2e your website produces. As simple as that.
The website is created by Wholegrain Digital agency - a well-known company that generally promotes a sustainable approach. It makes these resources extremely reliable. Moreover, they transparently present all research results and processes on their website, “Sustainable Web Design”, so you know exactly how they calculate it.
Long story short, in the above statement, they described their solution pretty well, explaining why you can be sure the results are accurate. So what does this page tell us?
After pasting a link, you get to know how much g of CO2 our website produces per visit. Below the fold, you will find a few exciting facts, e.g., the amount of CO2e emitted by your website vs. its equivalent website built in Bubble, etc.
When you dive into the sustainable world, you're sure to notice that each region (EU, US, Asia, etc.) has a different footprint, whereas websitecarbon.com simply unifies them all.
Pros:
- a well-described process of how the CO2e is calculated: https://sustainablewebdesign.org/calculating-digital-emissions/
- a renowned company behind the project
- the speed - works like a charm!
- an intuitive interface
- a library of well-optimized websites (i.e., websites with high results according to their calculator), so it is easy to find a benchmark for our industry
- brilliant analogies to give you a better idea of how much CO2 your website produces compared to s website built using, e.g., Bubble :)
- API to use their tools on custom solutions
- you can get the badge informing about the environmental impact of your analyzed website
- it's free
Cons
- it makes the assessment based on pasted links only. According to the documentation, they assume a constant amount of CO2 from 1 kWh for the whole world. It is excellent for general optimizations, but remember you will get different results for Sweden (where they predominantly use green energy) and Estonia.
- you don't get any recommendations on how to improve your page
In general, this tool is awesome. You can start your journey by measuring your active digital footprint with it. It's easy - paste a link and get the result. Also, knowing the company behind it, we assume they update the tool quite frequently (true so far!)
Ecograder
Use case: quick evaluation & recommendations

The team of Mighty Bytes created this tool, which is quite similar to Websitescarbon.com. They use the same algorithm - they even inform in the footer the core engine is exactly the same as on websitecarbon.com.
So why should you bother with this tool at all? Because it uses the Google Lighthouse engine that tells you how to optimize your website and improve its speed and eco score.
After you paste the link to your website, it will take some time to get results (like really "some time"). It's worth the wait, though. You find out how much CO2e your website produces each visit and calculate Web Page Scores.
Apparently, the inspiration came from measuring page speed - the maximum number is 100, and the final score comprises three components: UX, page size, and hosting. You get tips on how to get better results in each part.
I would say this tool is great for people familiar with Page Speed - the structure is very similar, but it takes different things into the calculation.
The one thing I'm worried about is the lack of info about changes, roadmap, etc. It looks like it was done and forgotten. If not for the information that they use the same engine as websitecarbon.com, I would have just left the website. Moreover, they mention they use Google Lighthouse but do not specify which version.
The websitecarbon.com website clearly informs about the latest update and upcoming plans. Ecograder.com is useful and provides even more insight than websitecarbon.com, but still, the tool made by the Wholegrain agency is my first choice.
Pros:
- reliable sources (same as websitecarbon.com footprint)
- helpful information on how to improve the results
- easy to use
- free
Cons:
- the app works pretty slowly
- for more technical people
- basic UI
- lack of information about the status of the project
Website carbon calculator by Greenpixie
https://greenpixie.com/website-carbon-calculator
Use case: basic evaluation of websites
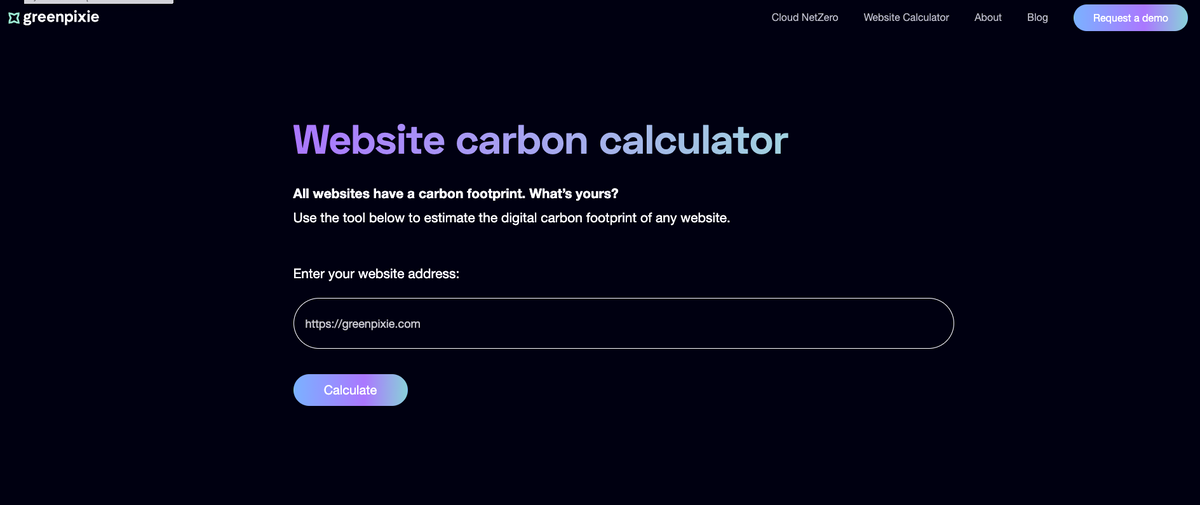
It's the most basic tool in this article (and probably on the web). The idea is the same as in other cases - paste a link and see the results. They display information on how much g of CO2e your website emits. In addition, they specify how much better you are than the competition (in percentage terms), though they don't explain how they calculate it.
Pros:
- simplicity
- free
Cons
- limited information about the project
Beacon
Use case: quick evaluation & data presentation
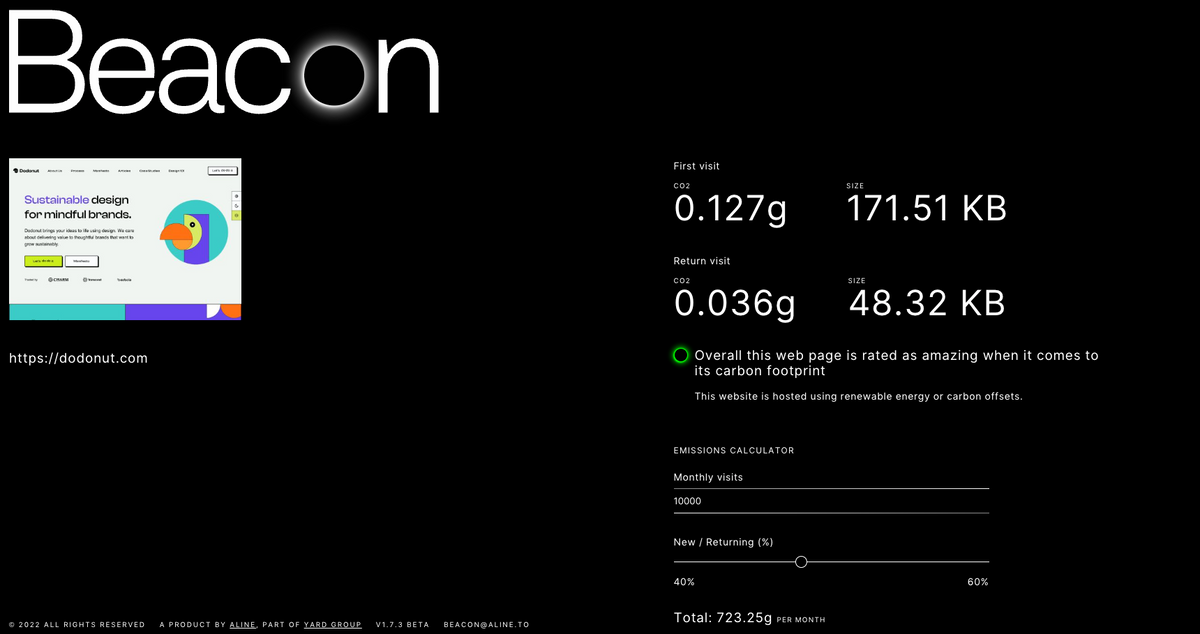
The tool created by Yard Group works quite similarly to websitecarbon.com and ecograder.com. You paste in the link and get the results.
The difference between this solution and similar sites lies in the presentation of the data. You can see how much CO2e is produced by new and returning visitors. It is probably the only source that offers this feature (already in our stats backlog).
The part that I like the most is the data presentation. They grouped information into categories such as images, script, fonts, documents, etc. It's pretty helpful - in Dodo, we have a bug that renders an oversized image in the case study section (I hope it's already fixed when you are reading this), which clearly points out that the problem occurs.
Thanks to Google Lighthouse integration, results include core web vitals, e.g., FID, CLS, LCP, and something they call opportunities, but it is quite general.
They also promote Chrome and Firefox extensions, but they don’t work the way I expected. When I installed the extension, I thought it would count my personal footprint, but I was wrong. After clicking the extension on any page, it simply takes you to the results page on digitalbeacon.com, so it's the same as typing in a URL. Moreover, it is available only on public websites, so you can not test your local host.
Interestingly enough, they have created a "badge" that you can put on a tested website to share your results. It is a simple solution, similar to the one we use at Dodonut in the footer. In our case, it is a custom script, but you can use Beacon to publish the result on your website as an image.
Unfortunately, I have not found comprehensive information on how they measure results. We know they rely on websitecarbon.com, and part of the team was involved in ecograder.com. In their FAQ, they mention imprints very laconically. We don't know why they estimate only 10% fewer emissions for green hosting compared to traditional hosting.
Another problem with this tool is that the results are completely different from the Website carbon calculator, and I must say I don't know why. Of course, on Digital beacon, they split the results for "first visit" and cached, but still, it doesn't sum up and I can not find any information on how they calculate it.
Pros
- modern-looking UI
- information about CO2e emissions for new and returning users
- CO2e emission for each category (styles, script, document, etc.)
- interesting way of presenting data
- option to download a chrome plugin.
Cons
- …it is pretty useless
- project at its early stage (October 2022), so there are some minor bugs
- so far lack of documentation.
Statsy
Use case: constant and accurate measuring
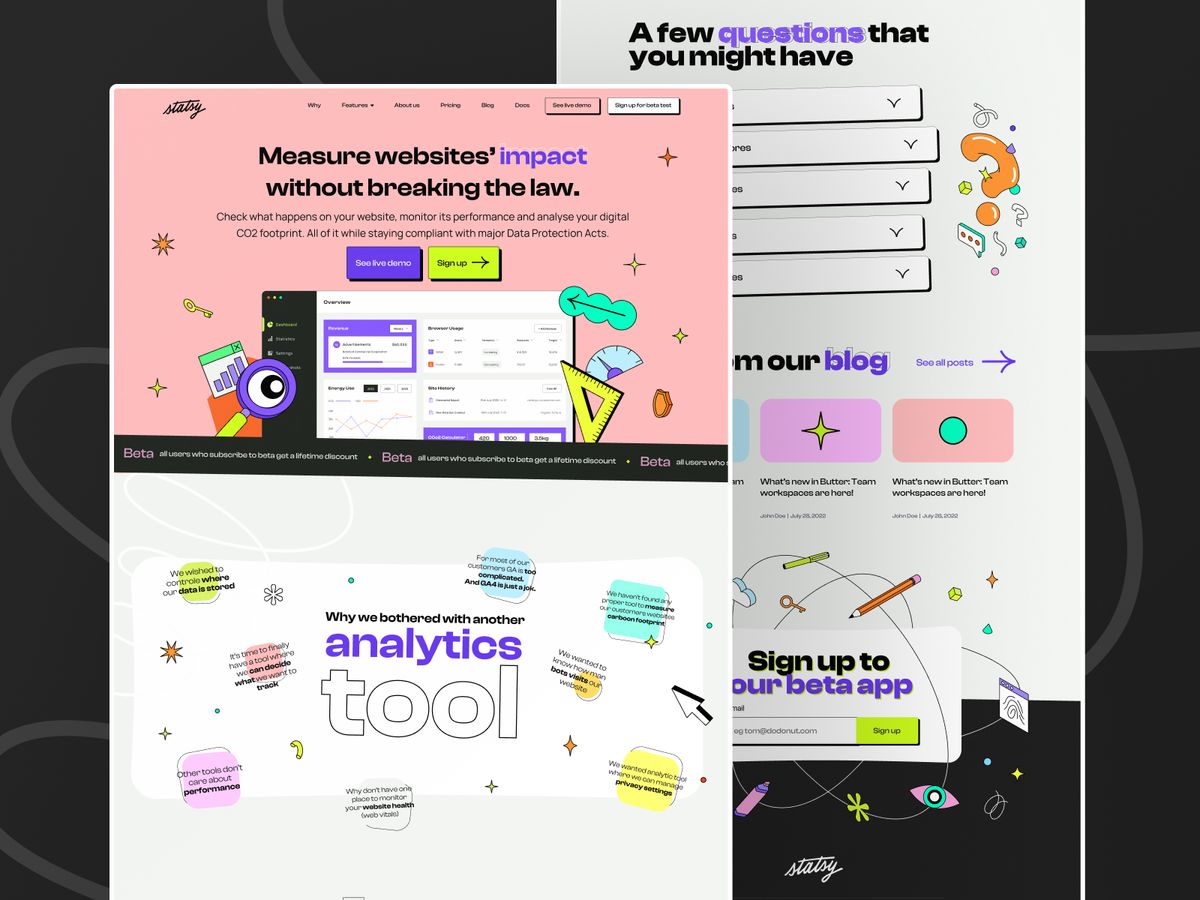
We’re glad that we also could add to the list the tool created by our team from Dodonut and Bejamas.
Statsy combines easy-to-use analytical tools and a CO2 module.
It was created as an alternative to other popular web analytics but with respect to the personal data of users. Statsy represents anti-tracking approach, that means it doesn't profile their visitors, and share your data, so don't generate a huge amount of passive digital footprint. However, it still can be a useful tool for advertisers and marketers who are preparing their strategy for search engines, like Google or Bing, and better search results.
Statsy has also been created because we couldn't find any tool that offered to accurately measure the amount of CO2 produced by visitors, considering their power grid and the weight of the website and server.
The analysis clearly shows which page has the biggest footprint. Thanks to the integration, we know how much CO2e a person in the Swedish or Polish power grid generates. It makes the results incredibly accurate. What is more, you can automatically offset the emissions.
We use the co2.js library - the same one that websitecarbon.com uses on its engine. It's the only open-source library maintained by an NGO. On top of that, we use an API to check if your hosting uses renewable energy.
We offer web vitals measurement, GDPR support, and a light script (40 times lighter than GTM) that will be implemented on your website. We can easily make your website's emissions data public to make it even more transparent. Statsy can replace Google Analytics in most use cases. We offer tools for comparing periods - you can check how your website performs relative to the previous period. We've also added team management features, so granting access to users is easy.
We are aware we still have things to improve - we have launched the project only recently. We are still working on the mobile view and fixing bugs, but everything is working, and we are getting positive feedback.
To start measuring, just sign up! You can simply gain access by creating an account and implementing a script into the head of your website, which means this tool is a bit different than the first two.
Pros
- the most accurate CO2 calculation based on your visitors
- CO2e per page
- CO2e emission calculation accounting for visitor's power grid
- analytics and web vitals features in a single tool - no need to use other solutions
- possibility to offset your carbon footprint automatically
- we take responsibility for our tools - we appreciate your comments and feedback.
Cons
- to start measuring, you need to implement the code into the head section
- the project is in an early stage (October 2022), so there are minor bugs
- some functions (web vitals) are paid for
- lack of documentation for now.
Cabin
Use case: continuous and accurate measuring
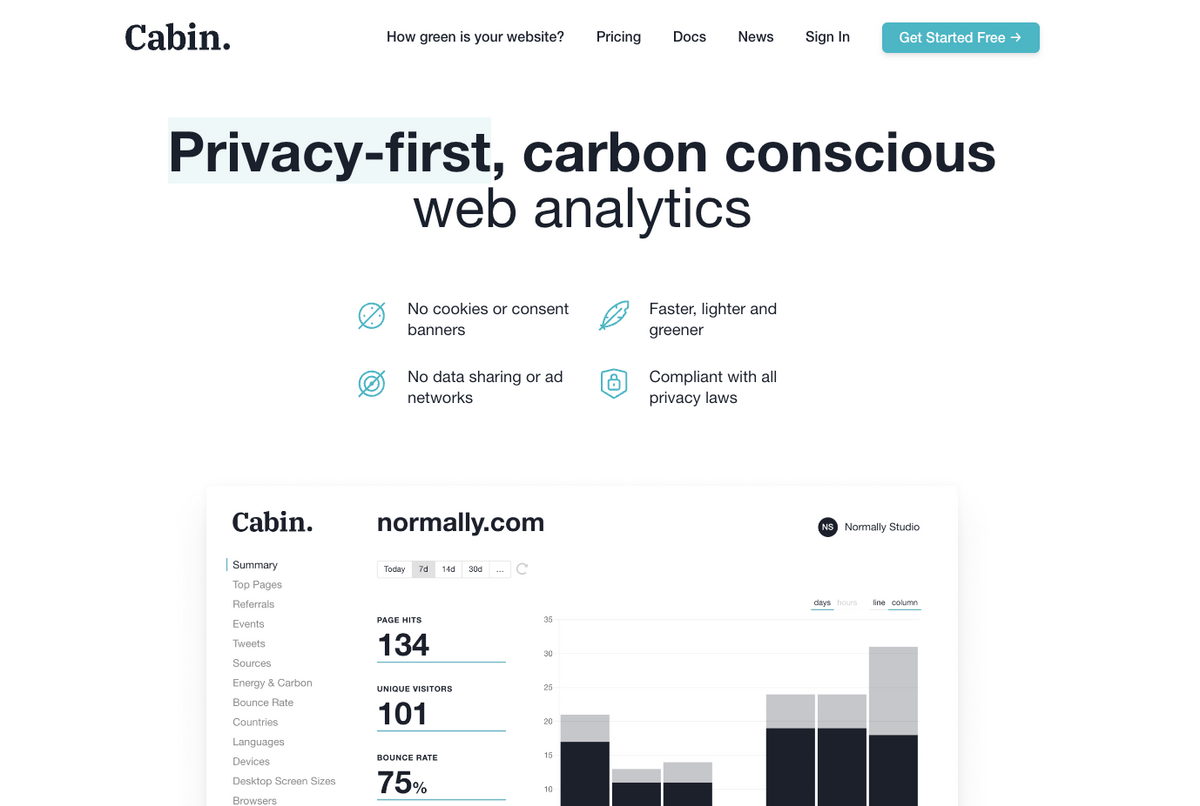
Withcabin.com is a great alternative to Statsy. They describe themselves as a data privacy analytical tool that also calculates CO2 emissions. The difference is that in Withcabin, measuring carbon emissions is an auxiliary function. The great news is it uses the same library as Statsy - co2.js.
The product has been on the market for a while, so when you treat carbon footprint as a nice-to-have feature and rely more on basic analytics features, this should be your first choice.
They provide the most important information like the amount of CO2 generated during data transfer and the average emissions from each page, so 90% of users will be satisfied with this solution.
They offer an exciting feature - a summary of all assets. You can check the state of all your assets, their weight, the number of requests, etc. It might help you optimize each page based on the performance of the overall assets.
Unfortunately, the free version of the app is pretty limited. You can track the basic stats of our website. To test pro features like CO2 emissions measurement, you need to spend at least $19.
Pros
- CO2e statistics per page
- they offer a stable version of analytics which makes this tool a wonderful alternative to X
- an interesting feature like website assets evaluation,
Cons
- to start measuring, you need to implement code into the head section
- carbon measurement is paid for
Ecoping
Use case: website footprint monitor
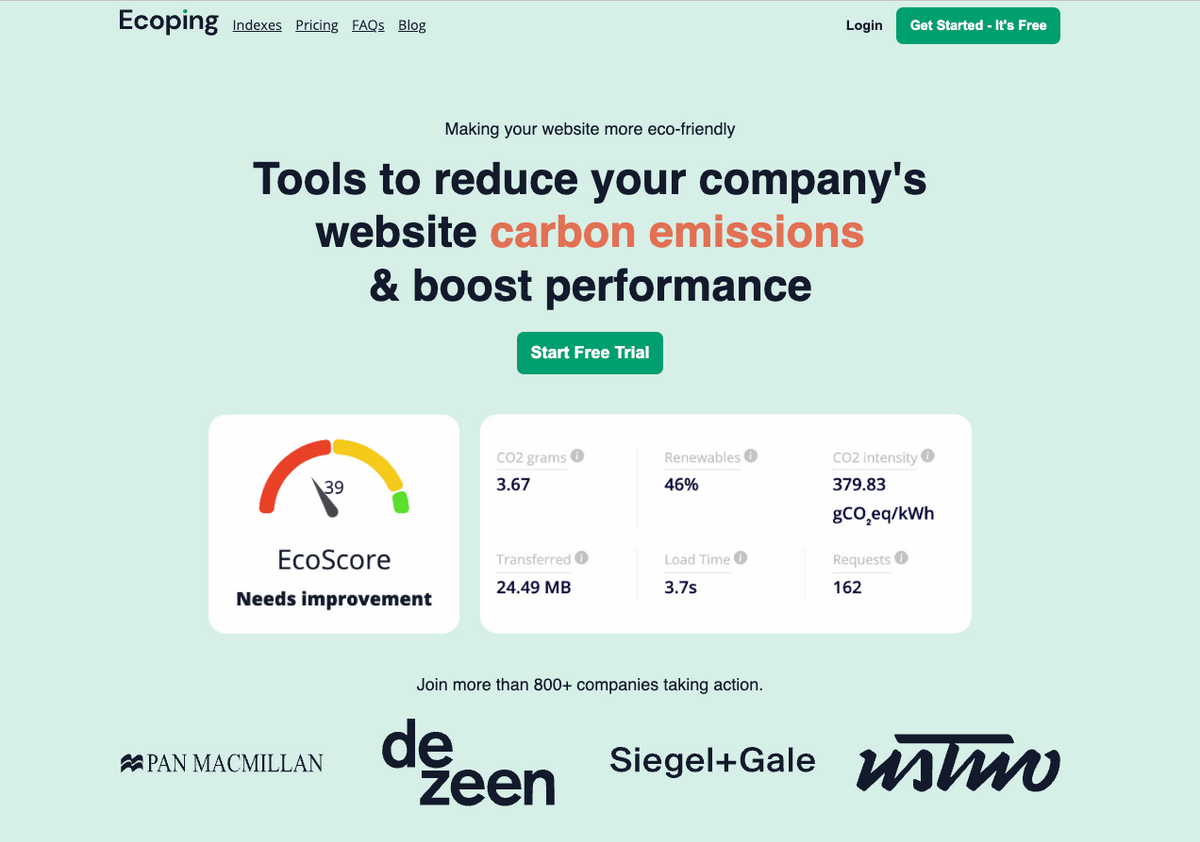
Also a good idea to start with measuring your website's environmental impact is Ecoping. This tool is created mainly to measure carbon footprint. The idea is simple - after registration, paste a link to your site, and Ecoping will check ecological parameters. It calculates, among others, the overall eco score, transfer, and load time. Their recommendations strongly affect the site speed score :)
This tool is all about analyzing the website from scratch. After pasting the URL to our website, the tool will analyze all your scripts, fonts, and CDN and will tell you how much energy produces for each element. It also checks if the CDN is on green hostings. I must say it is quite impressive.
It is worth noting that Ecoping also checks whether the hosting uses green energy. More importantly, the system verifies this independently and disregards green certificates, which helps fish out hosting companies that practice greenwashing.
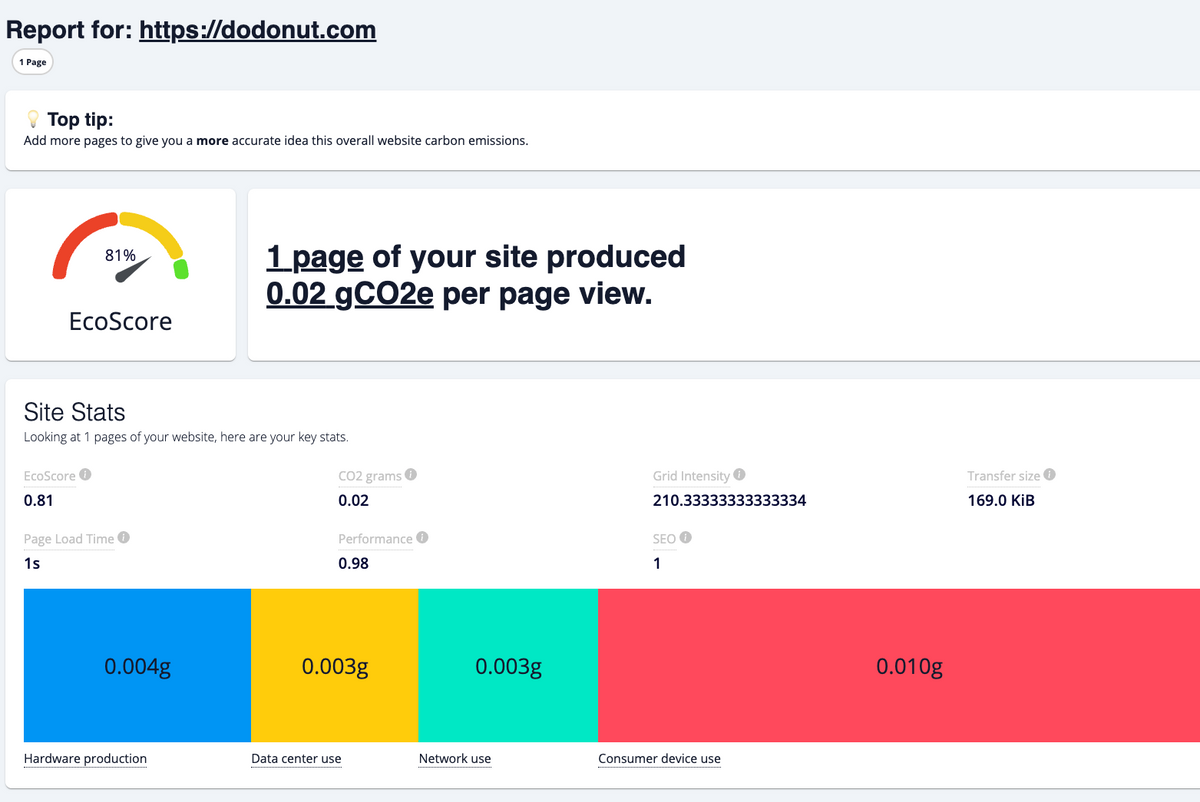
We found a few minor bugs. We know that Cloudflare pages are 100% sustainable, but still in Ecoping, we got a notification that we use non-green hosting. Other than that, we have a result of 0,02 g from a single visit, and it tells us that we are above average but in the tooltip, we get information that, on avarage, websites produce 1.15g per visit, so for sure, we met the standards. But besides that, this is the most complex tool for the deep analysis of your tool and the only tool that also checking CDN and external scripts.
The big difference between Statsy and Cabin is that Ecoping focuses only on eco scores, so you'll need separate tools for tracking statistics and website analytics. It even offers the option to integrate with Plausible, which doesn't have an eco-measurement function but is a good alternative to Google Analytics. The tool is helpful in case you don't want to ditch Google Analytics and need another tool to help you assess your carbon footprint.
Pros
- an accurate assessment of your website’s footprint with an account for the power grid
- focus only on CO2e
- no need to implement a script in the head section of your website to get the first insights
Cons
- available after sign-up
- you need a separate tool for analytics
- no info on how to optimize the website
Earth Mode by Johnnie Walker (Chrome)
(not recommended)
A plugin created for the campaign in 2016. Johnnie Walker offered to plant 75 thousand trees for Earth Day's project to reduce carbon footprint. Even though planting trees as an offset is not the best solution, the idea was great. Considering that the project was created 6 years ago, it is pretty impressive.
Unfortunately, there is no information on the current status of the project. My guess would be Johnnie Walker forgot about it, and it stalled. We learned from the FAQ they include the local power grid, measure the overall transfer from websites, etc., but there is no information if they use some popular library for these calculations or if they made their own.
Apps generate interesting summaries, but in the end, it is hard to say if the data is still up to date. Their users ask the same questions: https://www.youtube.com/watch?v=9f3Da6WJuKI
Pros
- easy to install
- Johnnie Walker paid off a fair share of our footprint (but i guess it is no longer valid)
Cons
- even though the data looks accurate, the project seems dead
CO2 emission by Advency
Use case: Personal tracking
A plugin created by the Advency agency. On their website, we found a lot of projects connected to sustainability, which makes us feel that they know what they are doing. They are responsible for Website Footprint. Unfortunately, we noticed in the console log that the API access was revoked, so we didn't put this tool on our list.
Pros
- a quick assessment of a website (an open page) condition
- accurate measurement based on the co2.js library
- stats on how many pages you visited and how much CO2e you emitted
Cons
- We are a little concerned because the main page website-fooprint.com is broken, and they haven't published anything on their blog since late 2020. Other than that, it's an awesome tool for personal measurement.
Offset Mode
Use case: Personal tracking
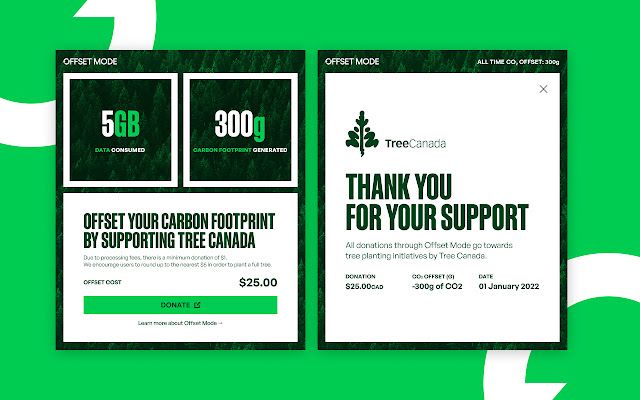
Offset Mode is a plugin that can be used to track your activity and measure transfer from all your activities across the web. You add it to Chrome, and that’s it! As I found out, it is integrated with Chrome to ensure accurate measurement of transfers. It takes into account all the dynamic data (which is not always the case) - a huge advantage!
The interface displays information about how much transfer you used and how much CO2e you produced. The website is quite transparent - it presents all data and variables in FAQ. Unfortunately, they use 0,23 kWh per 1GB which gives a rough estimation, and the final estimation is totally inaccurate compared to Statsy's.
Nevertheless, they offer an offsetting system. It's based on planting trees - far from an efficient method of removing CO2e from the atmosphere but still better than nothing. Here we talk about it in another article about carbon offsetting. Check other way to carbon offsetting in our Resources website.
Carbonalyser
Use case: Personal tracking
The plugin is available only on Mozilla but looks like an advanced project. It features eye-pleasing data visualization. You can decide how long you want to measure your footprint and reset data when you offset your footprint from the current session.
You can pick a location, and the plugin will calculate your footprint. I dare to say it - the UX and UI are not exactly user-friendly. Anyway, the biggest problem is Mozilla-limited availability, so it's not the tool I would pick for myself.
Pros
- nice visualization
- you can set your location
- possibility to measure short sessions
Cons
- available only on Mozilla
- terrible UX
Measure and reduce your digital footprint
Summary
There is still space for creating something amazing in the area of carbon footprint measurement. We have many solutions that help evaluate our carbon footprint, yet there is no perfect solution offering all the features such as offsets, first visit measurement vs. cache, factoring in location, and proper validation of green hosting
There is no doubt the internet contributes to global climate change. If you feel like doing something good for the planet, start your action with online tools that help manage your digital footprint. You can both reflect well upon your online activities when you use the internet and also as a website owner and creator to manage users' digital footprint with the flow of online data like its code and content. You can start your action, understand and enhance the online identity of your company and your personal brand by reducing your negative impact and showing your effort to make a web a greener place.
Need a Full-Stack Design Team?
Our team handles all aspects of design, making your ideas a reality.
This article emits ~0.23g of CO2.


