Printed vs. Digital. Which Marketing Solution Is More Sustainable? DesignWays Conf Case Study

Co-founder and Head of Design of the Dodonut agency. Lean UX enthusiast, a Certificated Design Thinking moderator, and a workshop facilitator.
Date added
Read time
7 minPeople often think that printed leaflets are harmful to the environment and that we should go fully digital. But if you've been reading our blog, you know that doing stuff online also has its carbon footprint. Being the folks behind WaysConf.com, we wanted to dig into this during our last event. We aimed to figure out if a digital agenda is a greener source in all situations.
So, we wanted to find out which marketing solution is more eco-friendly. Should we hand out printed agendas or go paperless and just have them on our website? By comparing these options, we could better understand the actual environmental effect of going digital.
Table of contents:
Introduction
To give you some background, keep in mind that we're not scientists. We've based our findings on real research and results, but some inconsistencies might exist. We conducted this experiment with the help of a few people, but if you have an idea of how we can do better, just let us know.
It's important to note that we conducted this experiment on September 19-20, 2022. We kept it in our internal notes for some time, and since then, some algorithms have changed, and even the DesignWays conference has become WaysConf. We've included screenshots from that time, but if you need more details, feel free to reach out to us at [email protected].
Our main goal, as always, is to make people aware that digital activities have an environmental footprint too, and can even become an e-waste of its kind. Blindly believing that digital is always better isn't wise, which we'll try to demonstrate by the end of this article. Enjoy reading about our little experiment!

How did it begin? Sustainability awareness.
As you may know, we created Statsy in September. This simple analytics tool tracks the number of visitors to your website, the number of pages they visit, and more. For each carbon footprint analysis, we implement the co2.js library created by the Green Web Foundation. The library is also used by tools like The Website Carbon Calculator and similar platforms.
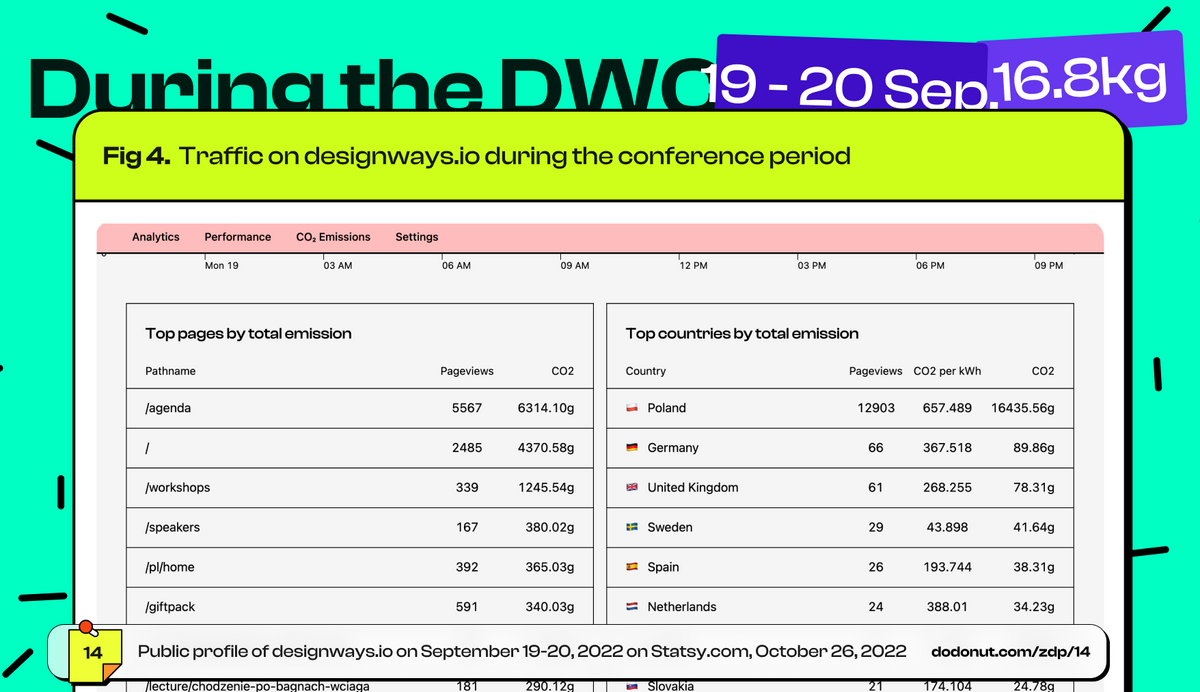
Once we knew exactly how many visitors were on our website and even determined which country they were from, we decided to make this information public by displaying the traffic data from the designways.io website during the conference. Initially, we just wanted to raise awareness about sustainability, but later we realized that we could do much more with that. We noticed that the most visited pages were the agenda and homepage, which led us to investigate whether having these resources online was truly more eco-friendly.
Carbon footprint of printed agenda
After deciding to make the comparison, it became clear we needed to know the carbon footprint of the printed materials. We found many publications on the environmental impact of leaflets. Our research showed that the carbon footprint depends on factors such as the type of paper and printing technology used (for example is it digital printing or offset).
We chose to use the numbers from the study "Carbon footprint and environmental impacts of print products from cradle to grave" by Hanna Pihkola, Minna Nors, Marjukka Kujanpää, Tuomas Helin, Merja Kariniemi, Tiina Pajula, Helena Dahlbo, and Sirkka Koskela. Since the range was 20-30g per leaflet, we decided to use 30g in our calculations.
For our event, we printed 1500 agenda leaflets, which allowed us to quickly calculate the following:
1500 leaflets at 30g each totals 45,000g, or 45 kg
1500 leaflets at 20g each totals 30,000g, or 30 kg
This quick calculation indicates that our leaflets generated something between 30 to 45 kg of CO2.
General carbon footprint for digital materials of Designways.io
The first part was a breeze - we just used scientific research for each leaflet, and then the math was easy-peasy. Now comes the tricky part - figuring out the carbon footprint of our website and the environmental impact of digital agenda.
We examined the website's overall performance. Regrettably, it wasn't very well optimized. The initiative engages people from outside Dodonut, and we have limited resources, so we stick with Webflow.

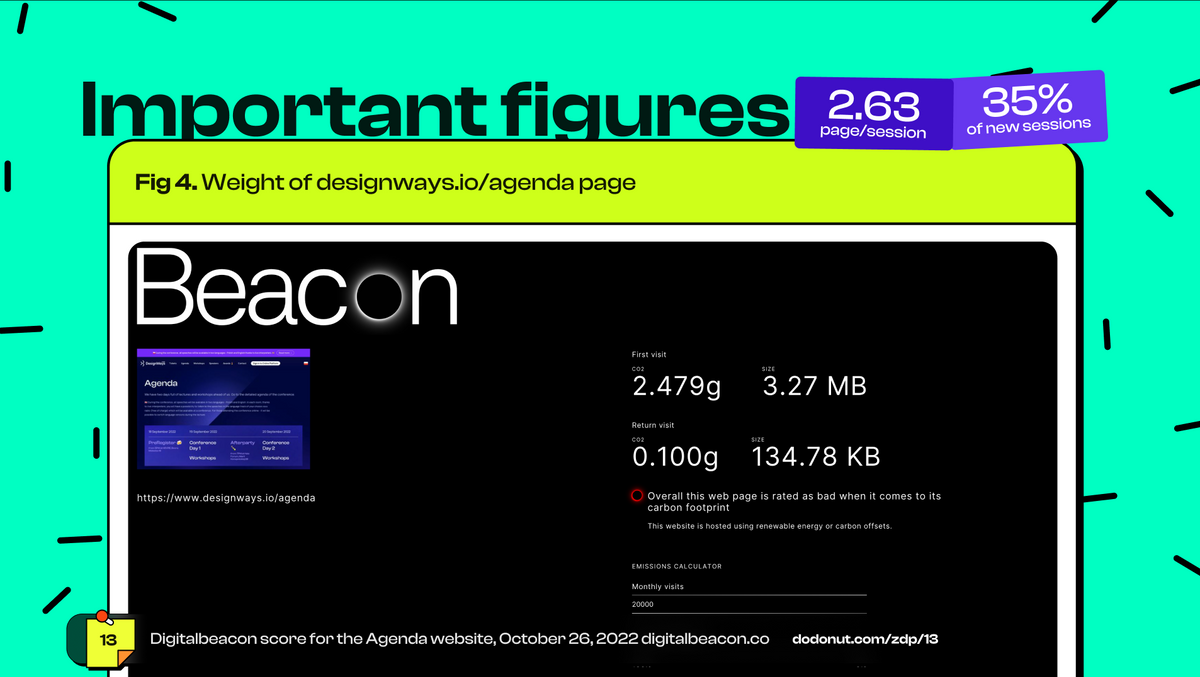
Here's the scoop - each visit to the agenda page on fresh electronic devices generates about 2.48g of CO2. But, when you revisit using cached devices, it's only 0.1g of CO2. So, let's say a single leaflet's carbon footprint is around 30g. It means you'd need to pull up that page on 12 different devices, or 8 if we're talking about a 20g footprint, to match the carbon output of one leaflet. So, if you only use one printed leaflet, it's pretty much a long shot for our not-so-slick website to be a more sustainable option.
But here's the thing. The Digital Beacon uses average numbers for stuff like the electric grid, network type, and all that. Let's dig into these details.
Detailed calculations by Statsy & co2.js
As mentioned earlier, we used Statsy.com, our own analytics tool. For each visit, we adapted the official CO2.js library by the Green Web Foundation, which automatically calculates the digital footprint based on:
- data transferred by a user
- type of connection (for mobile internet, energy consumption is much higher than a fiber connection)
- the country's electrical grid
- type of session (returning users consume less energy because only necessary files are downloaded)
We noted that visitors don't just visit the agenda page. They usually first land on the homepage and then navigate to the agenda. To be even more precise, we decided to account for the entire traffic on designways.io. Essentially, we applied a filter for the 19th and 20th of September to see how much CO2 we produced during the event.

During the event, we generated 16.8 kg, or 16,800g of CO2, with the majority of users heading to the agenda page. Knowing the amount of CO2 we produced, we could quickly determine the equivalent of printed agenda leaflets:
16,800g / 30g equals 560 leaflets
16,800g / 20g equals 840 leaflets
We hosted 1,240 attendees at the event and printed 1,500 leaflets. In the worst-case scenario, the result is double. However, as you can see, we're not talking about numbers in the thousands.
Electronic and paper communication. What do you need to keep in mind?
Our experiment was primarily intended to provoke thought. We need to keep a few aspects in mind:
- The results we present are based on a scenario where we printed agendas for the event. The web traffic would have been much higher if we hadn't printed the leaflets.
- The carbon footprint of our digital event appears particularly bad because Poland's electricity grid is one of the least efficient in Europe. In most EU countries, where renewable resources of energy is more popular, the digital footprint should be much lower.
- We haven't calculated the carbon footprint in a scenario where we would recycle 50% of our agendas, which might decrease total carbon emissions.
- We accounted for the total traffic on the website, which undoubtedly provides more information than a single leaflet.
- The entire SWD or 1byte.js model is purely an estimate, though the most accurate we have. Again, our goal is to make you think about the digital carbon footprint.
Can electronic publications be worse than traditional print marketing?
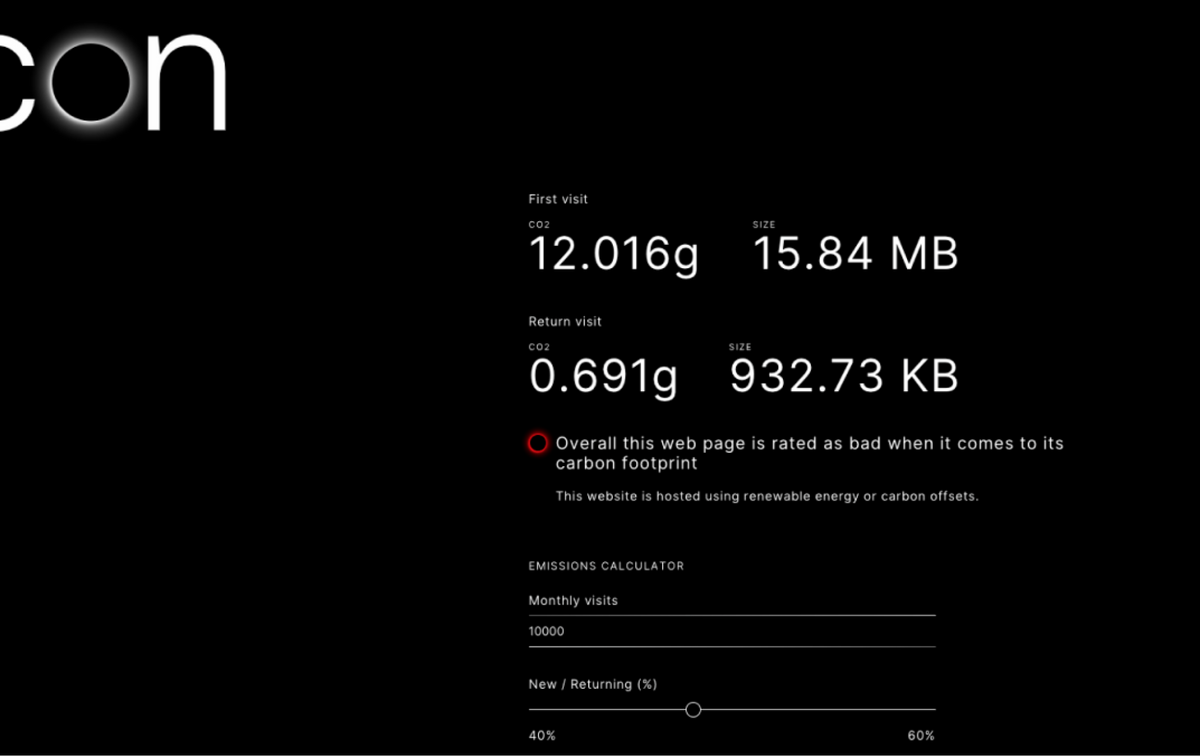
Yes, we actually found a page from one of DesignWays' well-known competitors that wasn't environmentally friendly. They've since updated their website, and we don't want to tarnish their reputation, but the screenshot from their previous digital setup should give you something to ponder.

Here's a screenshot of the competitor's page. As you can see, the first visit on a new device causes a carbon dioxide footprint of 12,016g. It's common for a single user to visit the page once from a desktop and once from a mobile device. It yields worse results than a single leaflet (24g vs. 20g in the best-case scenario for leaflets), and that's just for opening a single page. The conference is promoted as eco-friendly because the agenda is fully digital, but is it really sustainable? I don't think so.
What are the reasons for such enormous results?
I’ve decided to check how they achieve such high results:
- the previous website was not well-optimized WordPress
- they used plenty of heavy digital marketing scripts
- caching was enabled but not optimized
- they used autoplay video and not optimized images
As you can see, achieving such results is not so hard.
Digital versus paper agenda. Which is more sustainable?
Conclusion
In conclusion, our experiment aimed to challenge the popular opinion that digital alternatives are always more eco-friendly than their printed counterparts. It is common to take the approach "go paperless and save trees". However, it is not really the case. While our findings showed that the carbon footprint of our digital agenda was more environmentally friendly than paper and the footprint generated by printed leaflets, various factors can influence these results, such as the efficiency of a country's electricity grid or the extent to which printed materials are recyclable. Additionally, we found that some supposedly eco-friendly solutions may not be as sustainable as expected, given the carbon footprint of their digital activities.
The key takeaway is that we should consider the global scope of the environmental impact when choosing between digital and printed materials. Blindly believing that digital is always the greener choice can be misguided, as the sustainability of both options depends on multiple factors. By staying informed and weighing the pros and cons of each approach, we can make informed decisions that contribute to a greener and more sustainable future.
References
-
Pihkola H., Nors M., Kujanpää M. I in., "Carbon footprint and environmental impacts of print products from cradle to grave", 2010
Need a Full-Stack Design Team?
Our team handles all aspects of design, making your ideas a reality.
This article emits ~0.23g of CO2.


